CompareGuru Financial Services is an authorised financial services provider FSP. 47696
Municipal debt totalled over R211 billion in 2016. But where does all of this come from and which Municipality has the highest debt?
Along with the release of the Financial Census of Municipalities Report, StatsSA has identified which local municipalities are most in debt.
The figures were taken from a 2016 census which was recently published by the national statistics body. StatsSA's analysis ranks the municipalities according to their debt ratio - which weighs their assets versus their debts.


"To put it simply, the debt ratio provides an indication as to how much municipalities rely on borrowed money to finance their assets," StatsSA says.So what did they find?
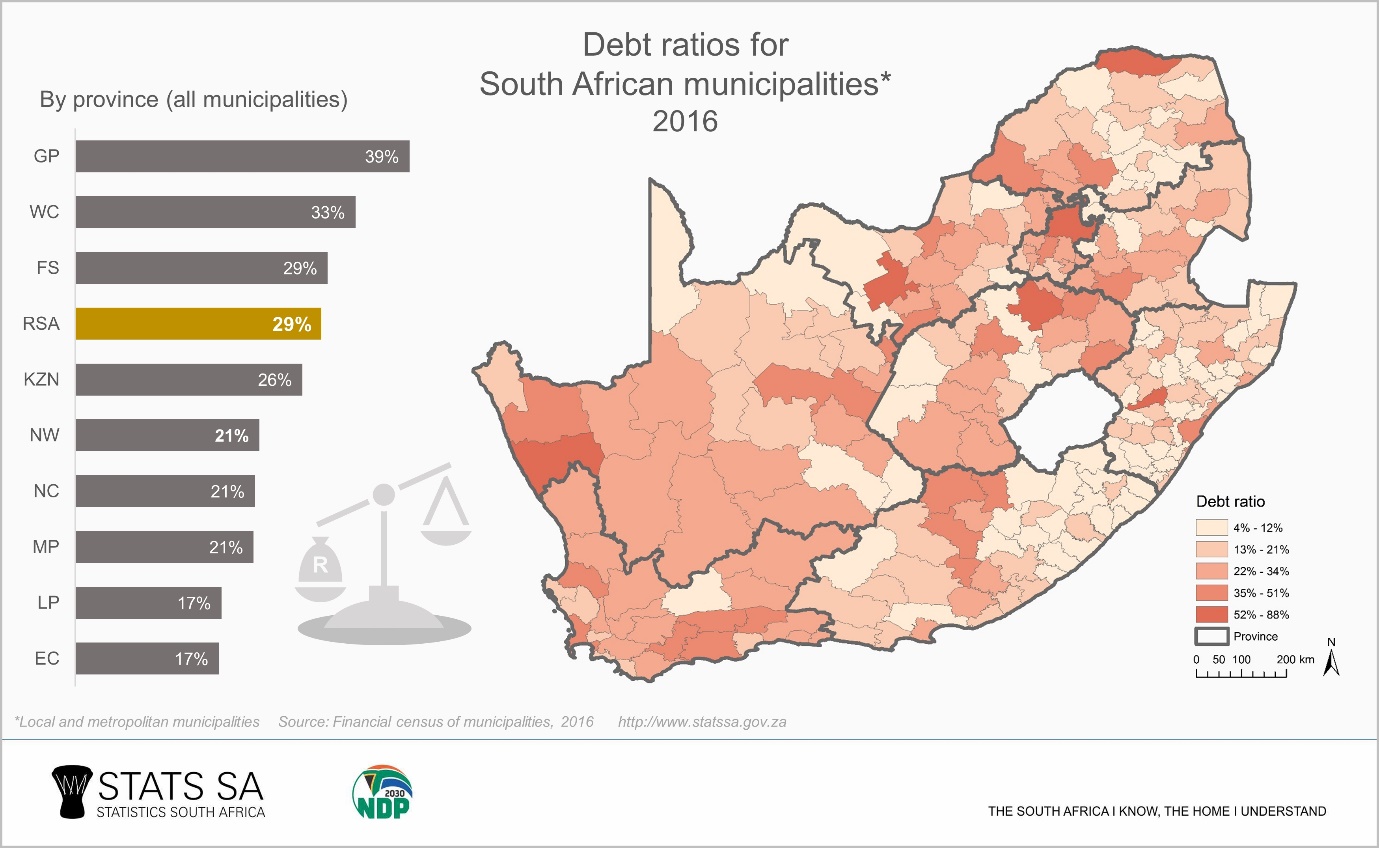
Provinces With The Highest Debt
By averaging all the municipality debt ratios within a specific province, StatsSA was able to see which provinces had the most in-debt municipalities. The national average is a debt ratio of 29%, but the top three in-debt municipalities exceeded or equalled this. The average of 29% is a slight increase from 28% in the previous year."Municipal debt – which includes both non-current and current liabilities – totalled R211 billion in 2016. With total assets worth R737 billion, that translates to a debt ratio of 29%. In other words, 29c of every rand used to finance municipal operations was in the form of debt," StatsSA explained.The debt for the 2015 financial year had stood at R196 billion, meaning debts rose by around R15 billion in 2016. Gauteng was named as the province with the highest debt ratio, with a ratio of 39%. The Western Cape followed in second place, with a ratio of 33%. The Free State took third place in the rankings of the most in-debt provinces, with their ratio matching the national average. But who took the place of the least in-debt? Limpopo and the Eastern Cape tied in last place, with both having a ratio of 17%. You can see the provincial rankings below:
Most In-Debt Municipalities
When taking a closer look at specific municipalities, more extreme variations in debt ratios are seen. StatsSA identified the three municipalities with the highest debt. These were:- Ngwathe, Free State (88%)
- Naledi, North West (65%)
- Mpofana, KZN (63%)
What Do These Figures Mean?
Debt ratios can still feel pretty abstract if you're not sure what is considered too high. Luckily, StatsSA offers some clarification on this."National Treasury has stated that municipalities should not have a debt ratio higher than 45%. So at the aggregate level, it seems that municipalities [on average] are in a healthy state in terms of their debt load," the group says,It is expected, however, that municipalities that include economic hub cities may have higher debt ratios. StatsSA explains that this is because they have more income and therefore can pay back bigger loans.
"Larger municipalities are perceived to be more stable financially and thus should carry a smaller risk of defaulting on loans. As a result, it should be relatively easier for them to borrow money," StatsSA says.
Presenting the Debt in Rands
The debt ratio is a great way to see the financial health of municipalities, but doesn't reflect just how much they owe. The census, however, provides these figures, showing the year-on-year increase for provinces. All provinces saw an increase in debt between 2015 and 2016. The highest increase was seen in the Free State, which saw a 27.6% in their loan values. The Northern Cape, Limpopo and Mpumalanga were also among the provinces with the highest increase in the value of their debt. Meanwhile, KwaZulu-Natal saw the smallest increase (3.1%), followed by the Western Cape (3.4%) and Eastern Cape (3.6%). You can see the provinces ranked according to the Rand amount of their debts below:- Gauteng - R86.4 billion
- KwaZulu-Natal - R34.4 billion
- Western Cape - R30.9 billion
- Free State - R14.4 billion
- Eastern Cape - R13.4 billion
- Mpumalanga - R10.4 billion
- North West - R9.6 billion
- Limpopo - R8.4 billion
- Northern Cape - R3.9 billion